 Network Topology
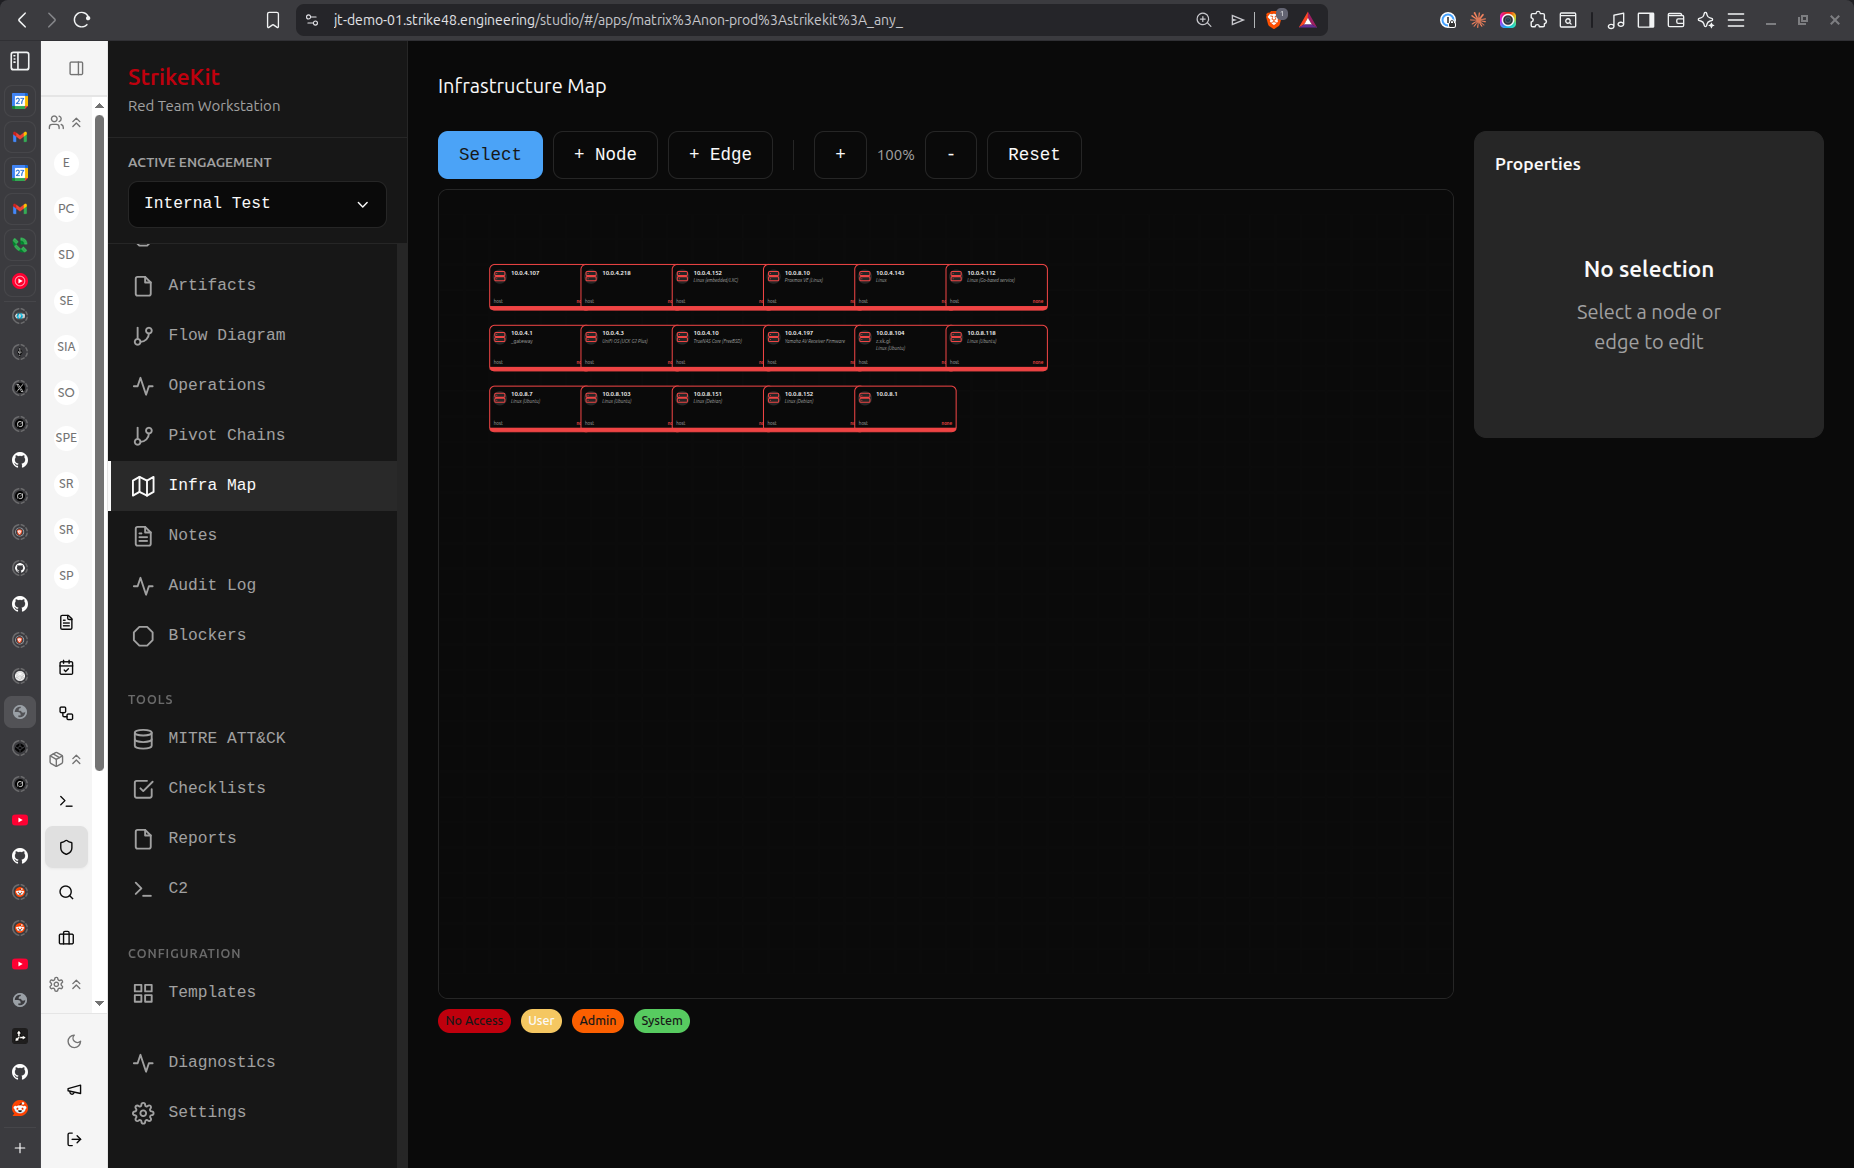 Network topology visualization showing discovered infrastructure
Overview
The Network Topology view provides interactive visualization of the engagement's attack surface and compromise progression.
Views
Map View
Visual network diagram showing:
- Targets: All discovered hosts and networks
- Connections: Network relationships
- Compromise Status: Color-coded by access level
- Service Information: Ports and protocols
- Pivot Chains: Lateral movement paths
Live View
Real-time operation monitoring:
- Active operations
- Current targets
- Operation status
- Recent activities
Visualization Features
Color Coding
Targets colored by status:
- Green: Discovered, not compromised
- Yellow: Compromised with user access
- Red: Compromised with admin/root access
- Gray: Out of scope
- Blue: Currently active target
Node Information
Click target node to view:
- IP address and hostname
- Operating system
- Running services
- Compromise status
- Access level
- Credentials that work
- Related findings
Connection Lines
Lines show relationships:
- Solid lines: Direct network connectivity
- Dashed lines: Pivot relationships
- Thick lines: Active connections
- Color: Matches target compromise status
Interactive Features
Zoom and Pan
Navigate the map:
- Scroll: Zoom in/out
- Click and drag: Pan around
- Double-click: Center on node
- Fit view: Auto-zoom to show all
Node Selection
Select targets:
- Click: View target details
- Right-click: Context menu
- Shift-click: Multi-select
- Drag: Move node position
Filtering
Show/hide elements:
- By status: Show only compromised
- By type: Hosts, networks, services
- By network: Filter by subnet
- By tag: Show specific categories
Layout Options
Auto-Layout
Automatic positioning:
- Hierarchical: Tree structure
- Force-directed: Physics simulation
- Circular: Circular arrangement
- Grid: Grid alignment
Manual Layout
Custom positioning:
- Drag nodes to position
- Save custom layouts
- Apply to reports
Pivot Chain Visualization
Attack Path Highlighting
Show compromise progression:
- Initial access point (highlighted)
- Lateral movement path
- Current position
- Compromised targets along path
Multi-Path Display
When multiple attack paths exist:
- Show all paths
- Highlight shortest path
- Display alternative routes
- Compare path efficiency
Export and Reporting
Export Formats
Save topology as:
- PNG: High-resolution image
- SVG: Vector graphics
- PDF: For reports
- JSON: Data export
Report Integration
Topology appears in reports:
- Executive summary (simplified)
- Technical section (detailed)
- Attack path visualization
- Network diagrams
Use Cases
Initial Reconnaissance
Visualize discovered infrastructure:
- Map attack surface
- Identify high-value targets
- Plan attack approach
- Understand network segmentation
During Exploitation
Track compromise progression:
- Show compromised systems
- Plan lateral movement
- Identify next targets
- Avoid detection
Report Generation
Demonstrate attack capabilities:
- Show network understanding
- Visualize compromise scope
- Illustrate attack paths
- Support findings
Best Practices
- Update regularly: Keep topology current as targets discovered
- Accurate connections: Document actual network relationships
- Clear status: Mark compromise status accurately
- Export often: Save topology snapshots
- Use in reports: Visual representation is powerful
- Manual cleanup: Adjust layout for clarity
Known Issues
Map Tab: Currently shows infrastructure visualization instead of actual network topology. Future update will provide proper network graph showing targets, connections, and pivot chains.
Workaround: Use Live tab for operation monitoring. Network topology graph improvements are planned.
Related Features
- Targets - Target management
- Pivot Chains - Lateral movement tracking
- Kill Chain - Attack phase progression
- Reports - Include topology in deliverables